1. Introduction
The following article explains how to you can create integrated web panels that will help you show collected data by your MQTT devices connected to your HUB at MyQttHub.com (complete language reference here: MyQttHub dashboard markup language reference).
These panels are designed to provide a ready to use solution that integrates data with clean and attractive panels that are usable for end users to show relevant data and manipulate their environment through the panel.
This walthrough will create a very simple panel that shows latest temperature registered on a particular topic. Throughout the example, you will see:
- How to create MyQttHub.com dashboards (panels)
- What’s the language used, and how it integrates with your HUB.
- What are the options to upgrade and modify your panel, how preview works, inline configuration or “go to code” option.
Once you finish this walkthrough, you will be able to expand your knowledge with the rest of options as they use similar mechanism (extending on what you already saw).
2. What we are going to create
We are going to create a panel using reference implementation from:
https://github.com/ASPLes/MyQttHub/blob/master/panels/reference/temperature.data.reference1.xml
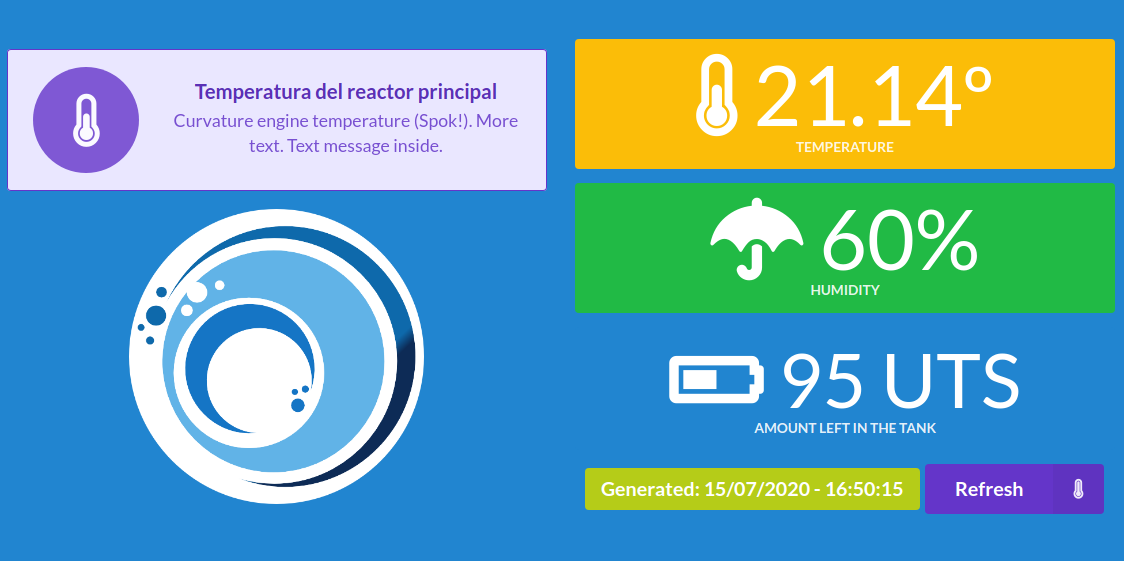
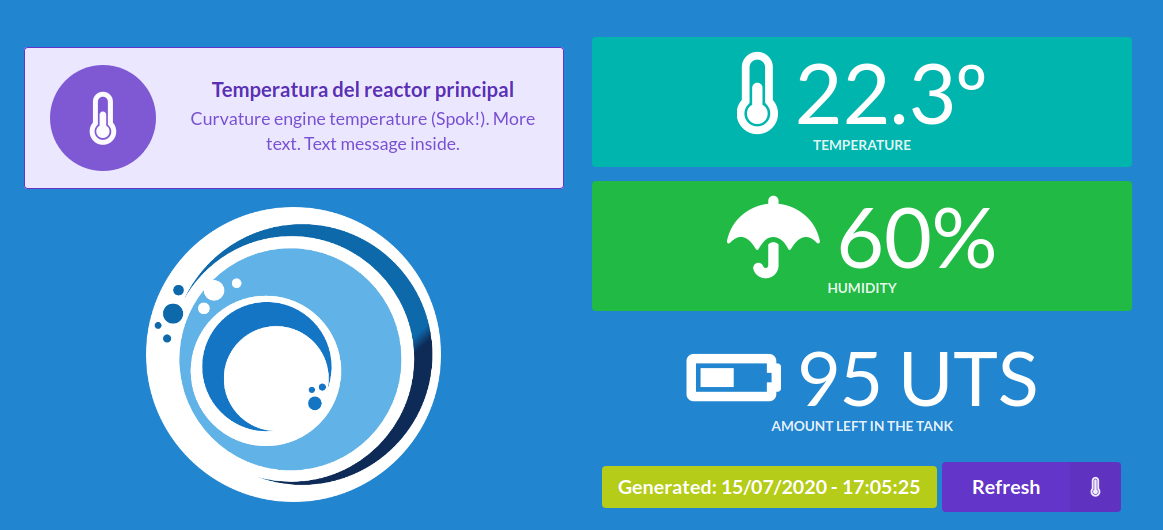
That panel looks like:
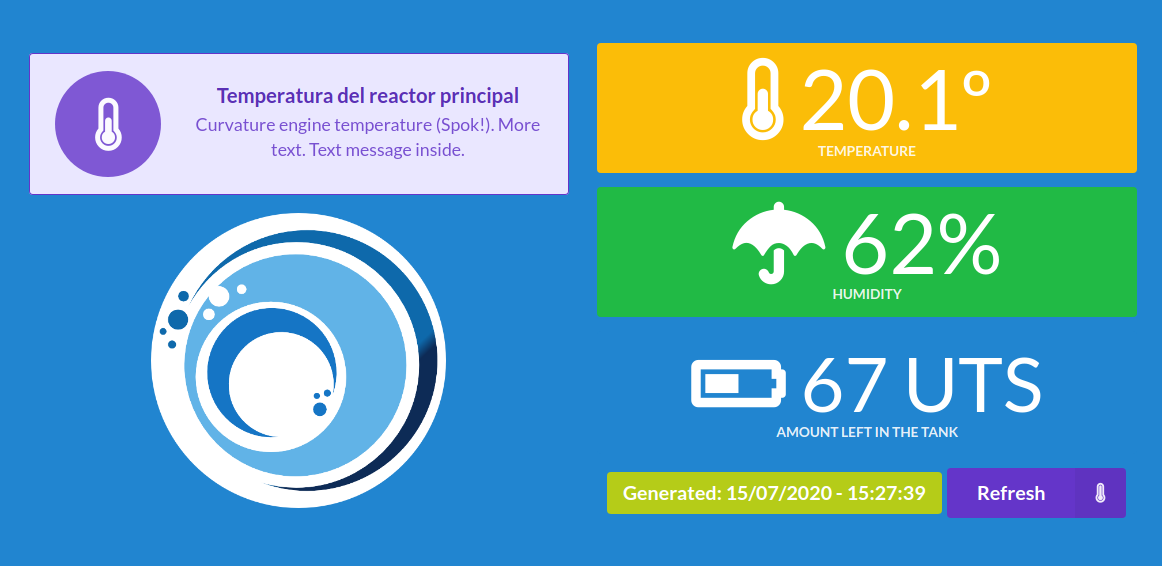
You can use this as a template to show other data, change colors, icons, messages, etc.
3. Let’s start with your first MyQttHub Dashboard!
-
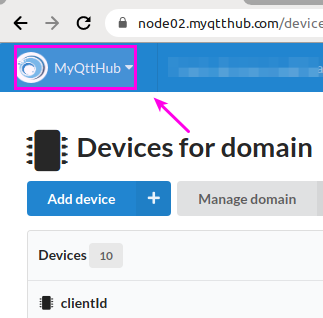
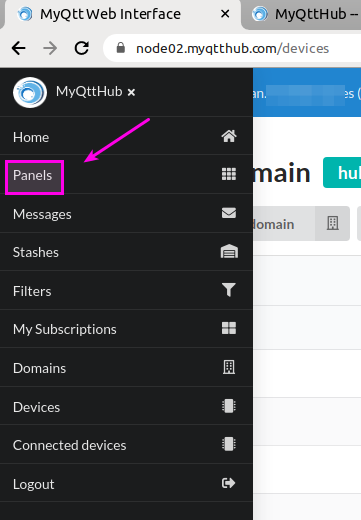
First, get into your MyQttHub account (with admin user), and click on Panels:
…now click on menu option: Panels:
-
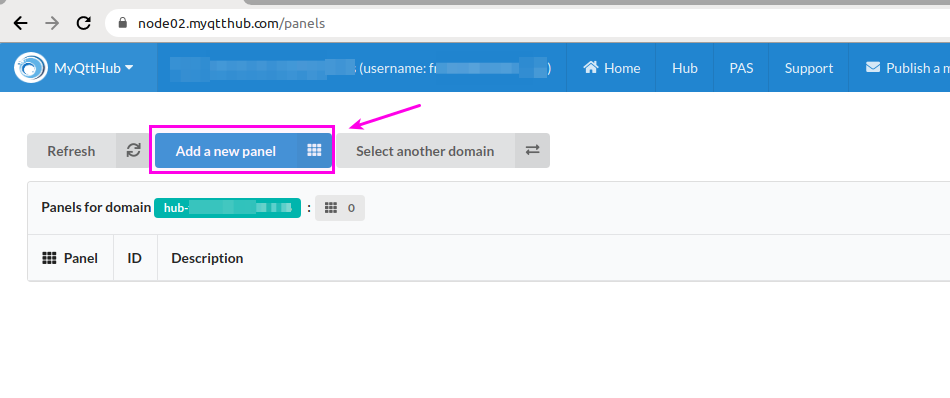
You will see the list of panels you already have created. Empty list if you don’t (right!). Now click to add a new panel:
-
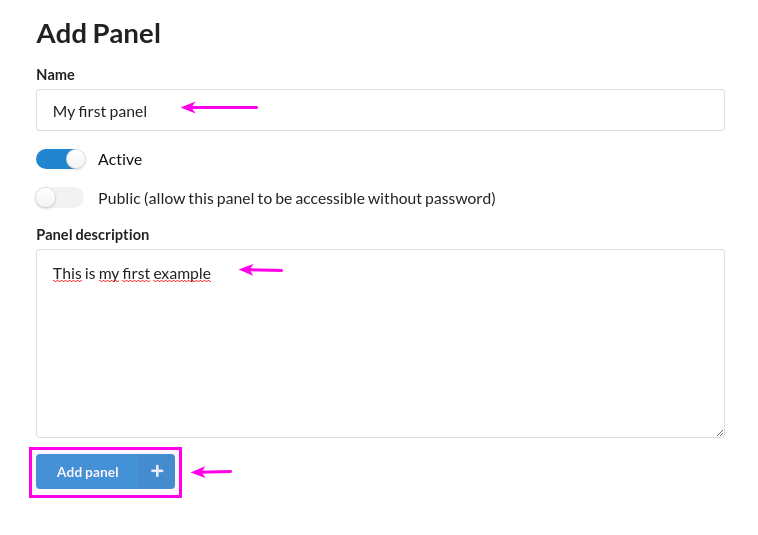
Now, enter an initial description for your panel. You can change it later, don’t worry:
-
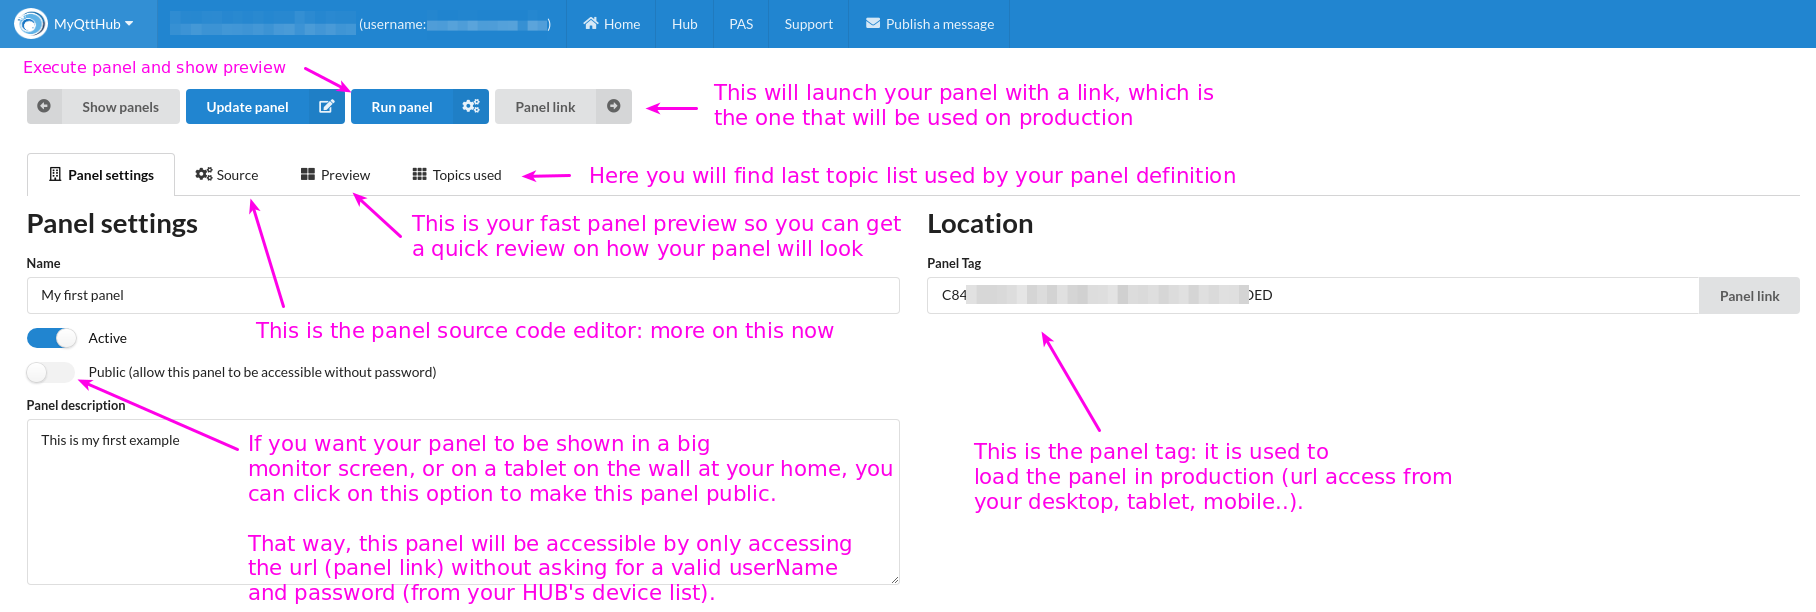
That will give you access to full panel workbench where you have different options you will be using while you create your panels. Here is an initial brief description:
-
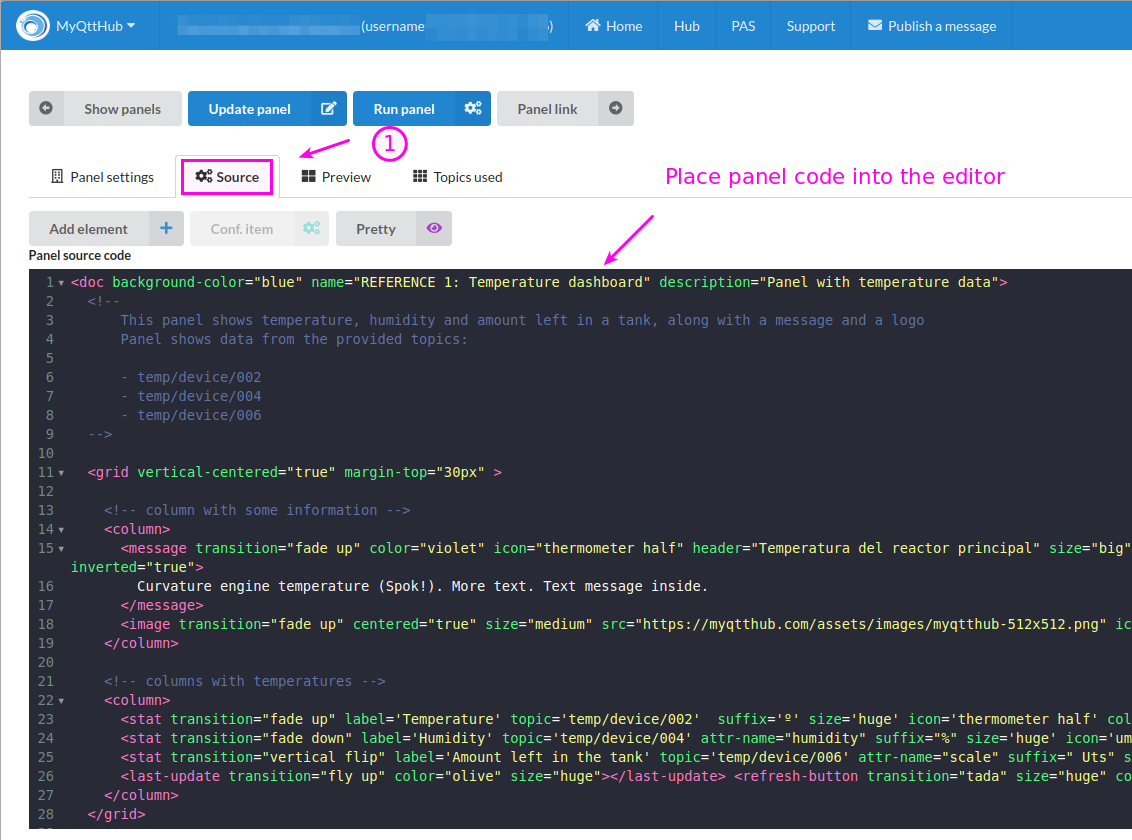
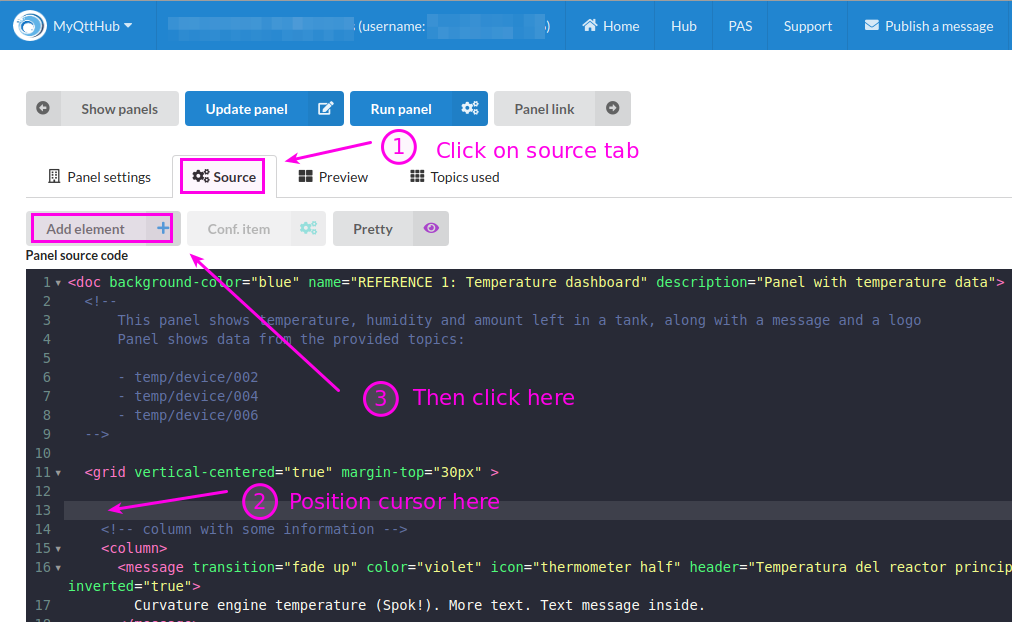
Now, go to the Source tab and place the content found at the link:
…you should see something like:
-
After that, you have a full working panel! Now see results by clicking on preview. You will see the whole thing moving:
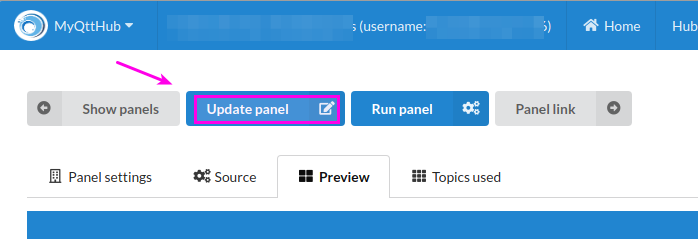
IMPORTANT NOTE: regularly save your panel code to avoid losing anything (click on Update panel).

4. Using topic attribute to extract and show data (key feature)
-
Because your HUB has no data available yet for topics used by this panel, you will see it is not showing anything that is useful.
-
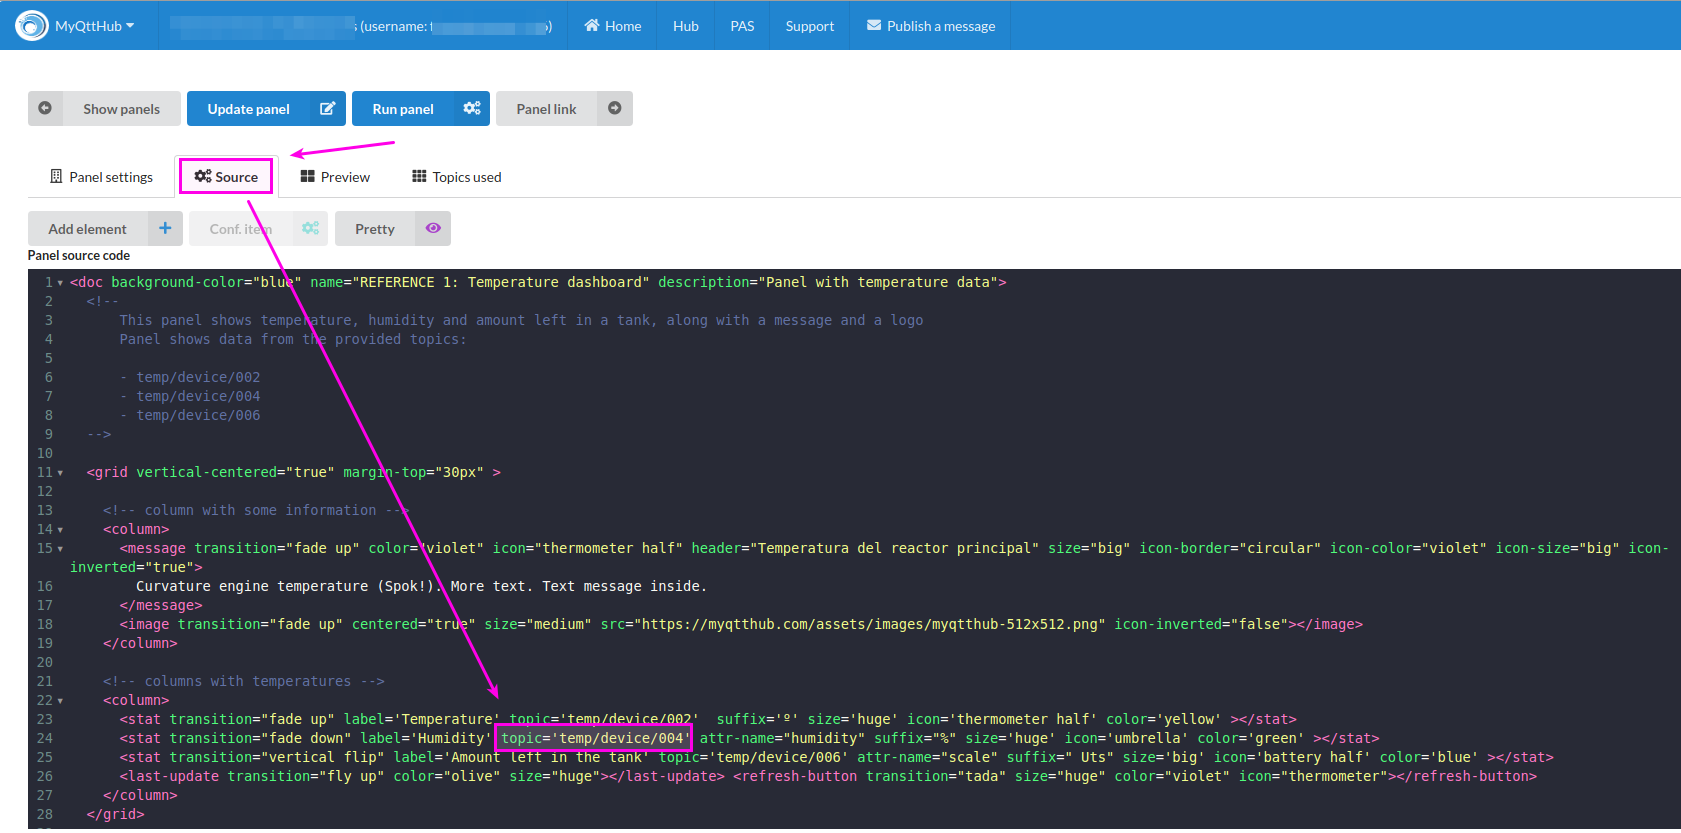
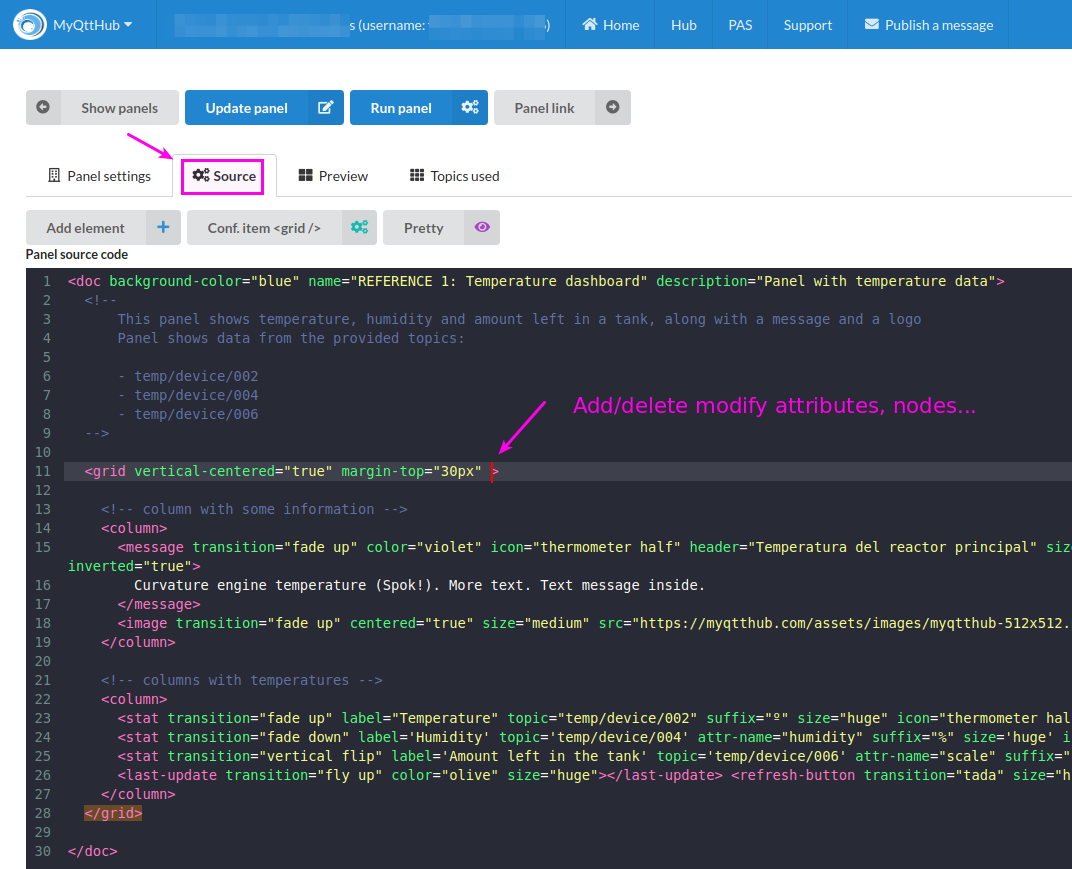
This happens because panel source code is doing reference to some topics (topic=“some/topic”) but those topics have no registered data. If you go to “Source tab”, you will see several elements doing topic use declaration like these:
-
With this element identified, you need to update your HUB to have some data to show. You have several options:
- Real MQTT device: Make some real MQTT device to publish information to those topics. Once in production, this will be the main form of topic updates.
- Use a developer MQTT device: like MQTT-Spy, so you can use it to publish topic information to these topics.
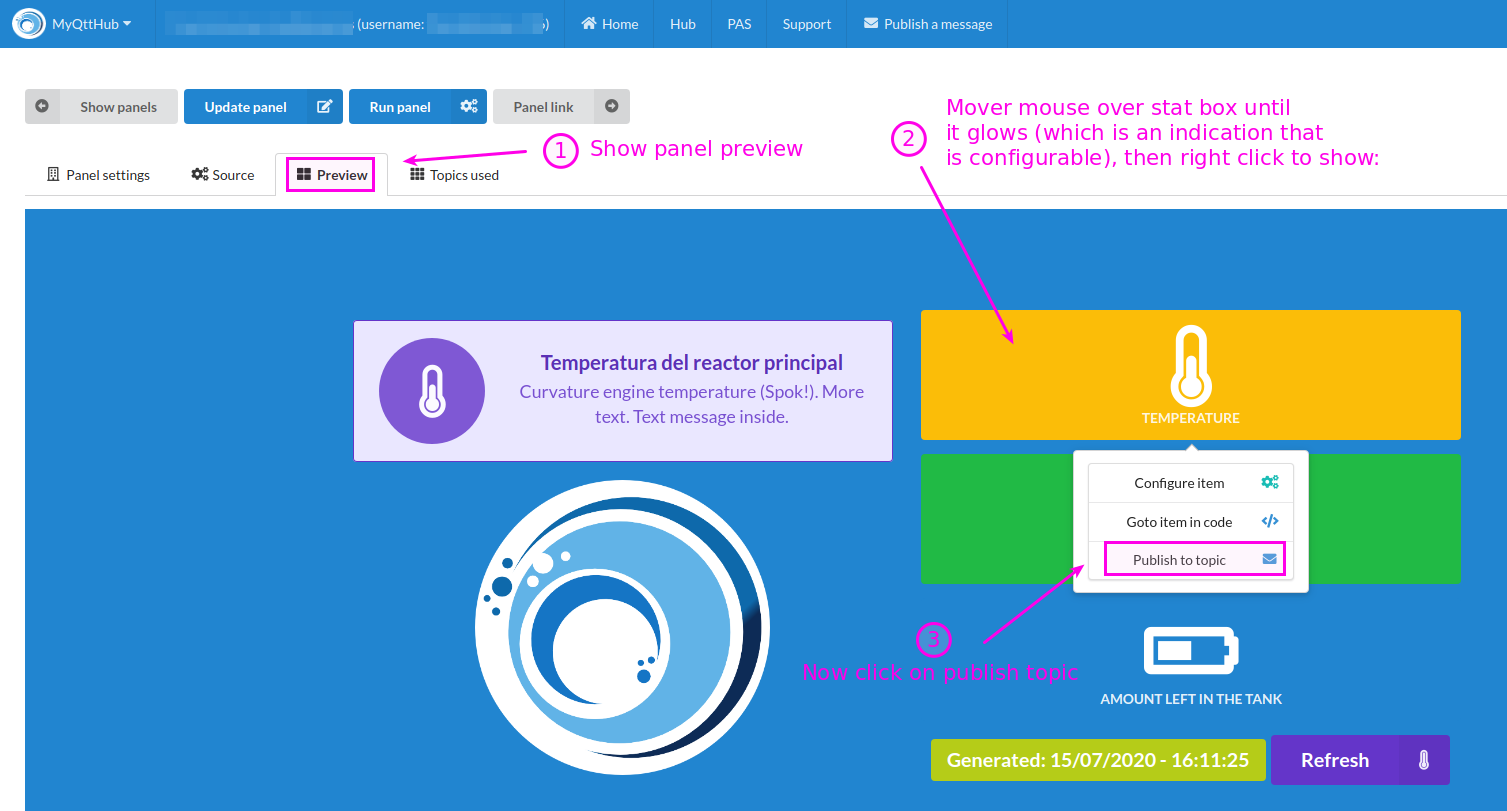
- MyQttHub dashboard inline update: but because we are prototyping, MyQttHub dashboards allows you to simulate this by sending updates (real MQTT PUBLISH messages) directly from the panel. Here is how.
-
Go to the Preview tab and right click on temperature message:
-
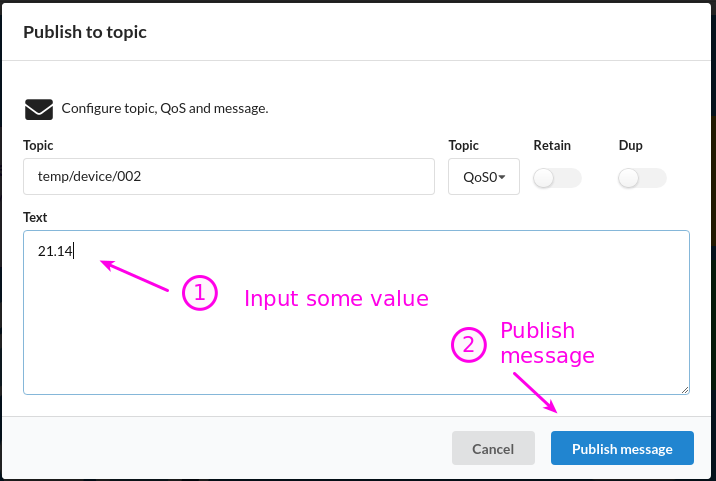
A publish to topic panel will show up. Enter a temperature and publish:
-
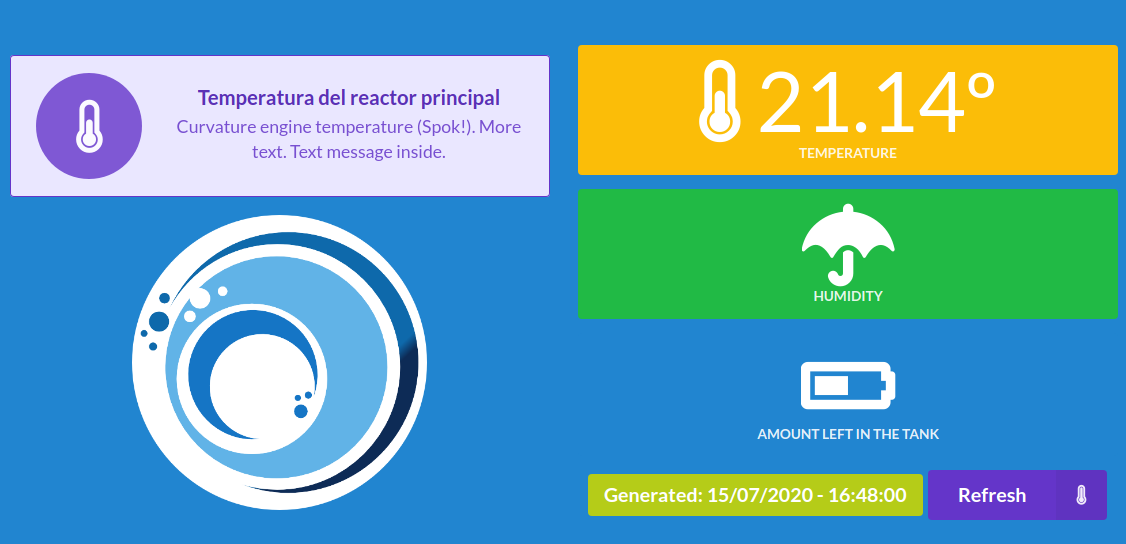
Right after that, your preview will automatically update, and this time, showing latest updated value:
-
Do the same for the battery and umbrella icon: move mouse over it, and right click over it to Publish to topic. After that, you should see something like:
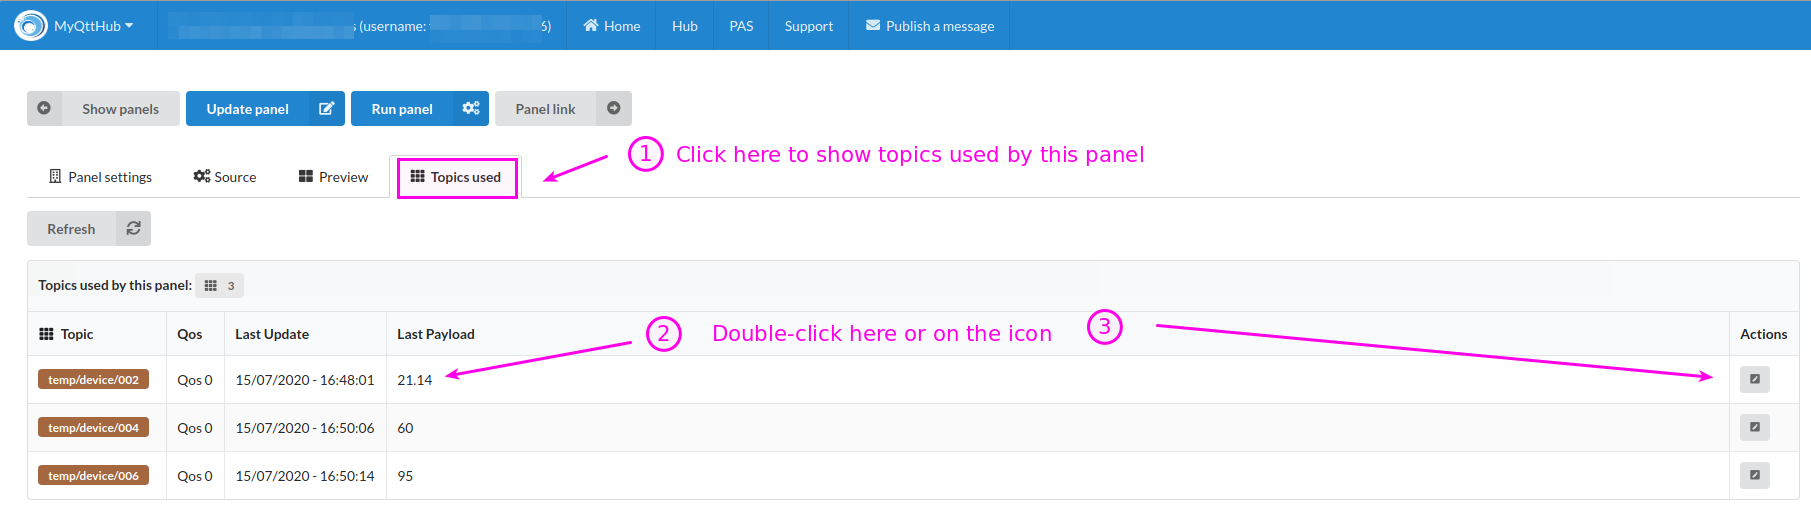
5. Using topics used tab to update topic values
-
Remember you can update topics latest state on the “Topics used tab”, by double click on the value or on the icon:
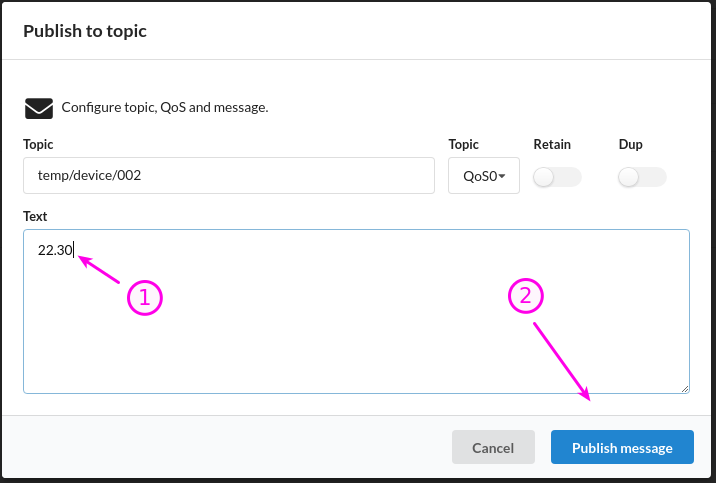
-
After that, the publish to topic window will show up so you can push new values there:
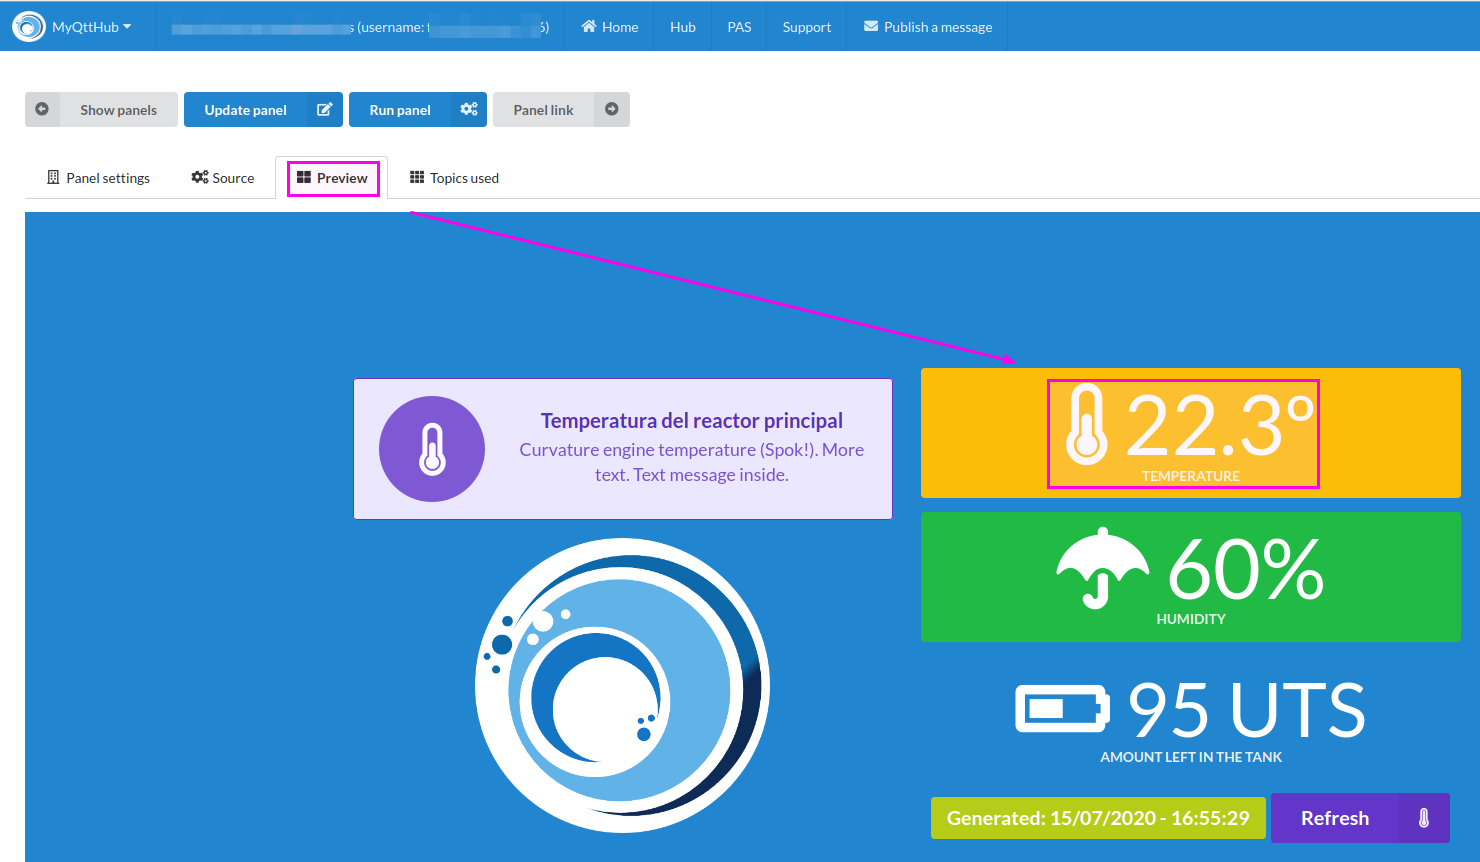
-
Now click on “Preview tab” to show latest value:
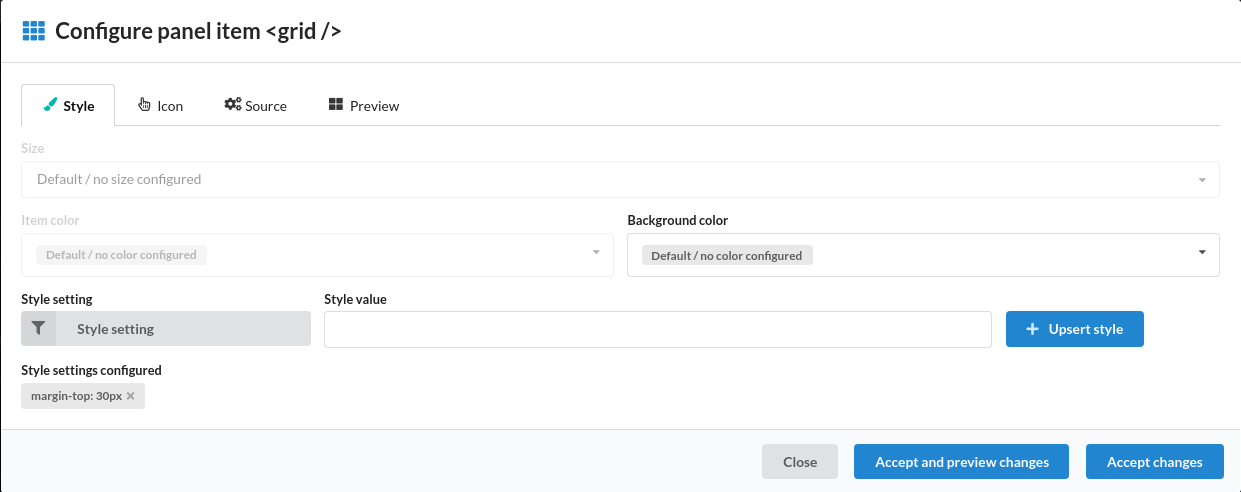
6. Configuring elements with configuration wizard as complement to code
The following is a feature you will be able to use at “Source tab” and “Preview tab”. It allows you to easily configure several aspects for elements you are using at your panels.
-
To use it from “Preview tab”, just right click on any element that glows when you move mouse over like:
-
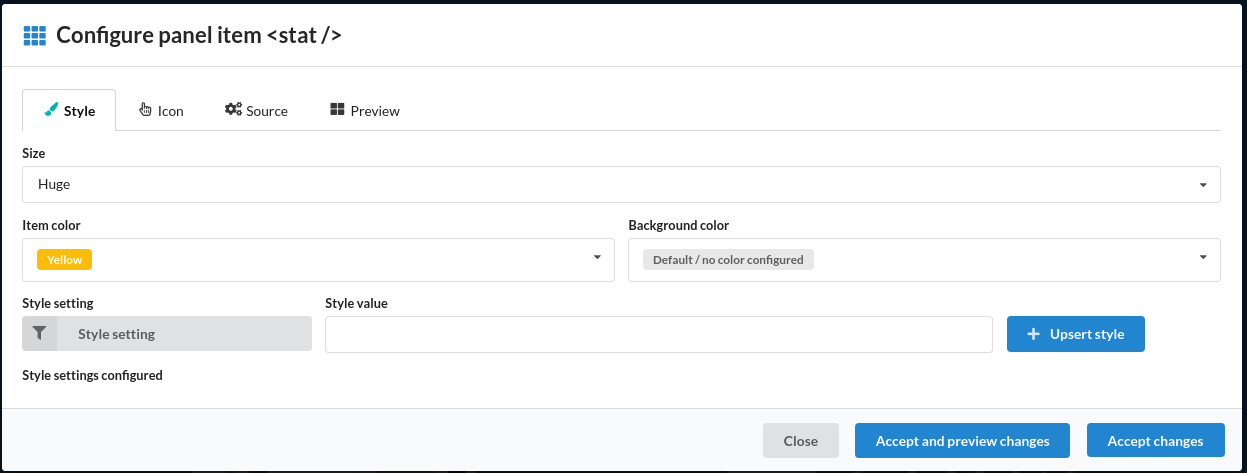
A new configuration dialog will show:
-
Change color (or any other setting) and then click on “Accept and preview changes”:
-
After applying changes, you will see them reloaded automatically:
-
Remember to “Save panel” if you are fine with current status:


7. Remember you have a source code editor (reference manual)
MyQttHub dashboard panels are designed in a way that should be easy to start with all dialogs and configuration windows you have already seen. At the same time, MyQttHub dashboard panels uses a very common and widely understood language: XML (without any extension).
This will allow you to configure all the details that needs your panel and that might not be covered by configuration windows and wizards.
Here is a quick review about options you will find at Source tab editor:
-
Remember that all these helpers and preview code is designed to help you start quickly. But also, take into account you can make changes directly into your panel source code:
-
As you can see, MyQttHub dashboard language is plain XML (nothing more). Here you will find complete reference for all features, attributes and options available for direct edition:
-
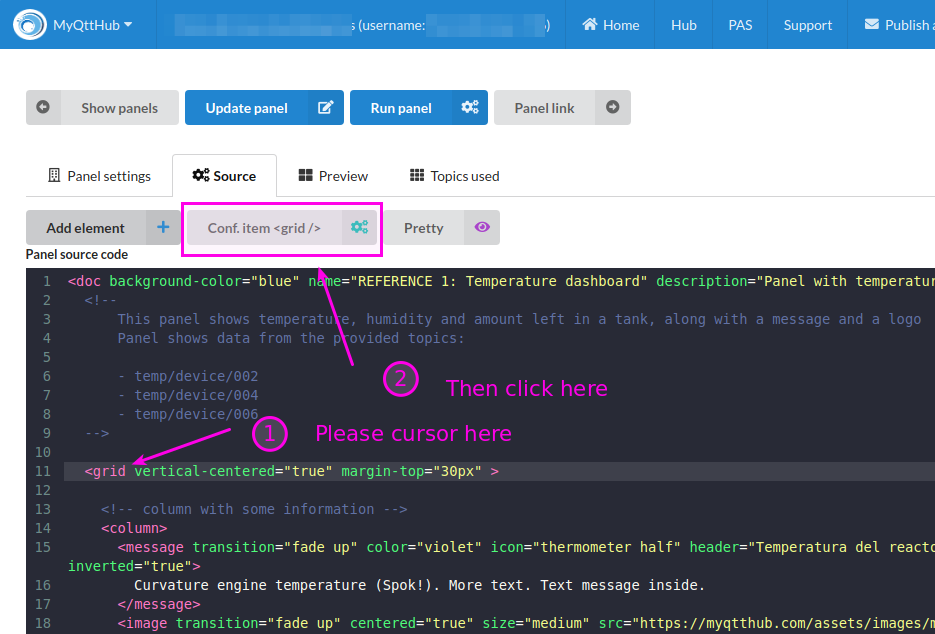
You can launch “item configuration wizard” by just moving cursor to the element you want, and then click to configure:
-
After that the Item configuration wizard will be shown:
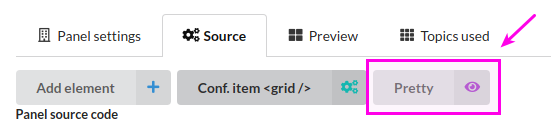
8. You can always indent your code after making changes
-
Because you might add a lot of code that needs indentation, to keep your panel clear and easy to maintain and debug, use the “Pretty” button. It will indent all your panel code:
-
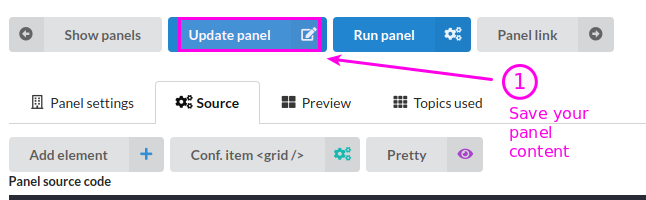
Remember to save your panel content after doing code indentation:
9. Support for quick snippets at source code editor
You can always take a look at the MyQttHub dashboard language reference to know more about elements and options available.
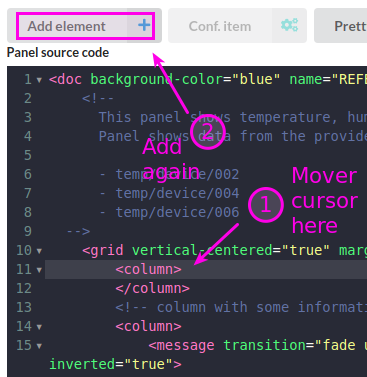
At the same time, you have a "Quick snippets" option that will help you add known supported elements directly from the source code editor. Here is how it works:
-
Go to the “Source tab” and position cursor at the place you want to add the element:
-
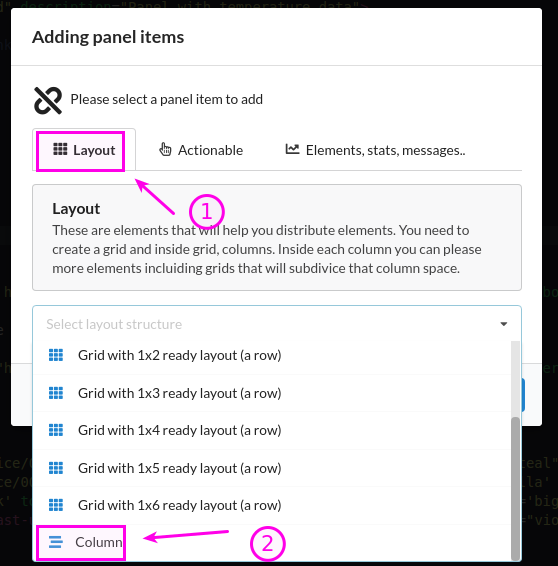
Now select to add a column:
-
As you see, right after selecting “Column”, it is added. Now move cursor inside and click to “Add element” again:
-
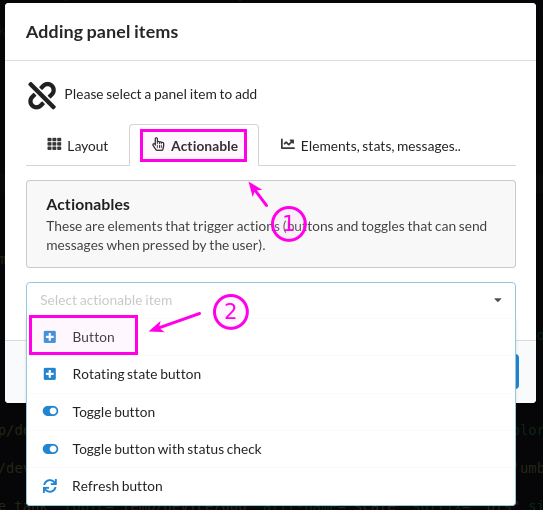
Now add a button so you can see how your panel evolves:
-
After that, a button with some default configuration will be added:
-
Click on preview and click on the button several times:
-
Again, remember to save your panel content after doing code indentation:


10. Moving your panel to production
So you are happy with your current panel configuration and you want to move it to production so it can be shown in a web browser, a monitor or a tablet like this:
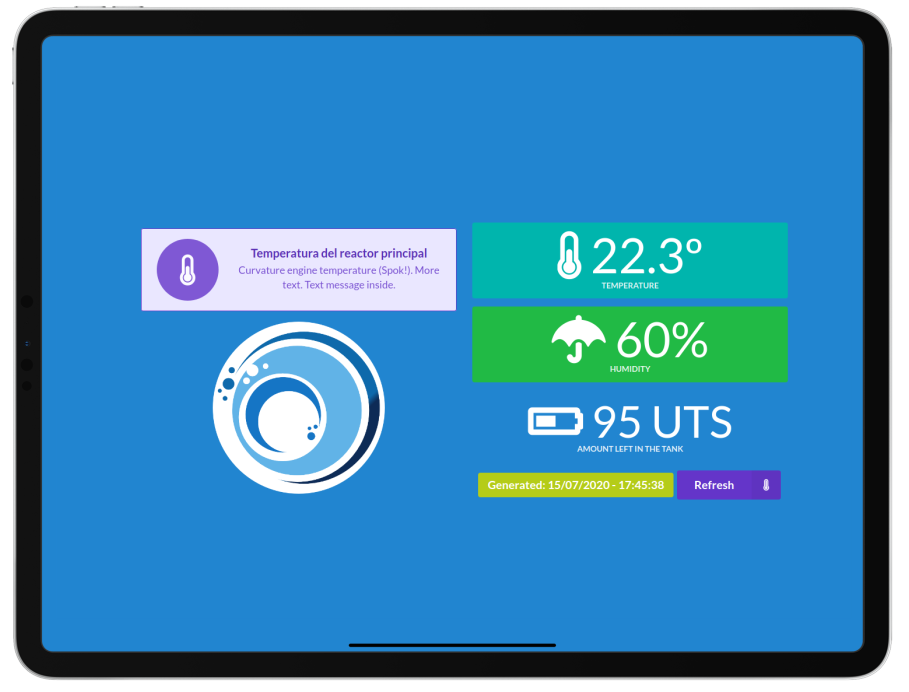
-
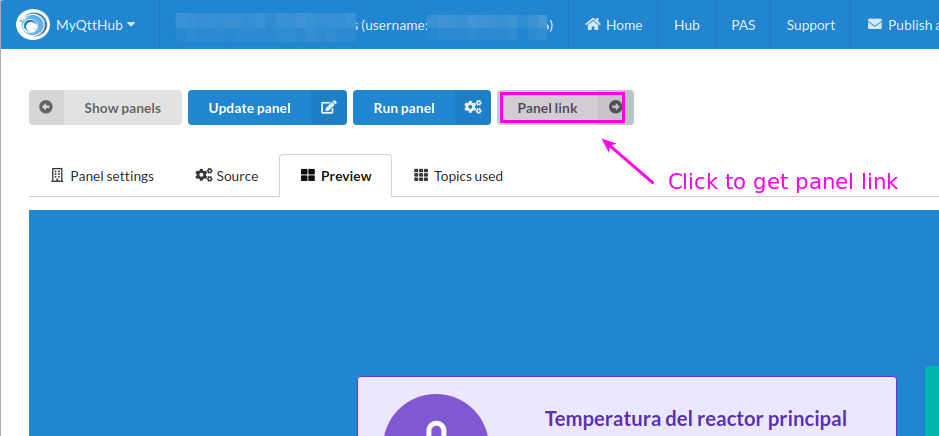
For that, click on “Panel link” option to make your browser launch your panel link that will activate everything without having all the developer options:
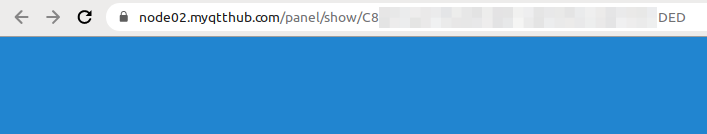
-
Now copy that URL and make a browser to load it to show your panel at the destination device.
-
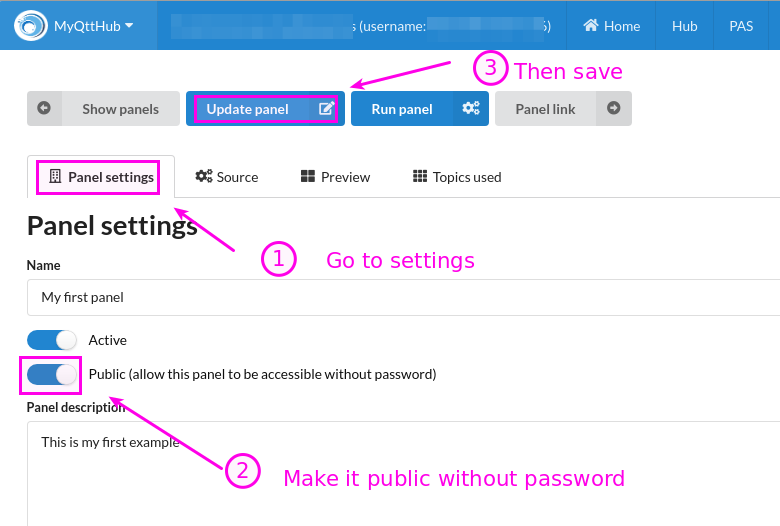
If you want your panel to be loaded without asking a valid userName/password from your MQTT HUB, configure your panel to make it public here:
11. How panels consume messages and optimize collection
Any time any of your panels are accessed, they consume message quota using the following indications:
- Panel definition: an amount of message quota because of loading your panel definition, that is, your panel definition is considered as a message that is relayed from your MQTT HUB to your browser. In that sense, any time your panel definition is downloaded, that will be considered as a single message consuming message quota using message measurer size as defined by your MyQttHub message measurer size.
-
See how MyQttHub message measurer size works at the following article: How messages are counted by MyQttHub
-
Data used by panel: Now, for the data loaded by the panel, MyQttHub collects all the data that will be used into a single optimized call (to avoid several or hundred of calls) and creates a single message. Then, that single message consumes quota using message measurer size as defined by your MyQttHub message measurer size.